

Community-Led Environmental Monitoring
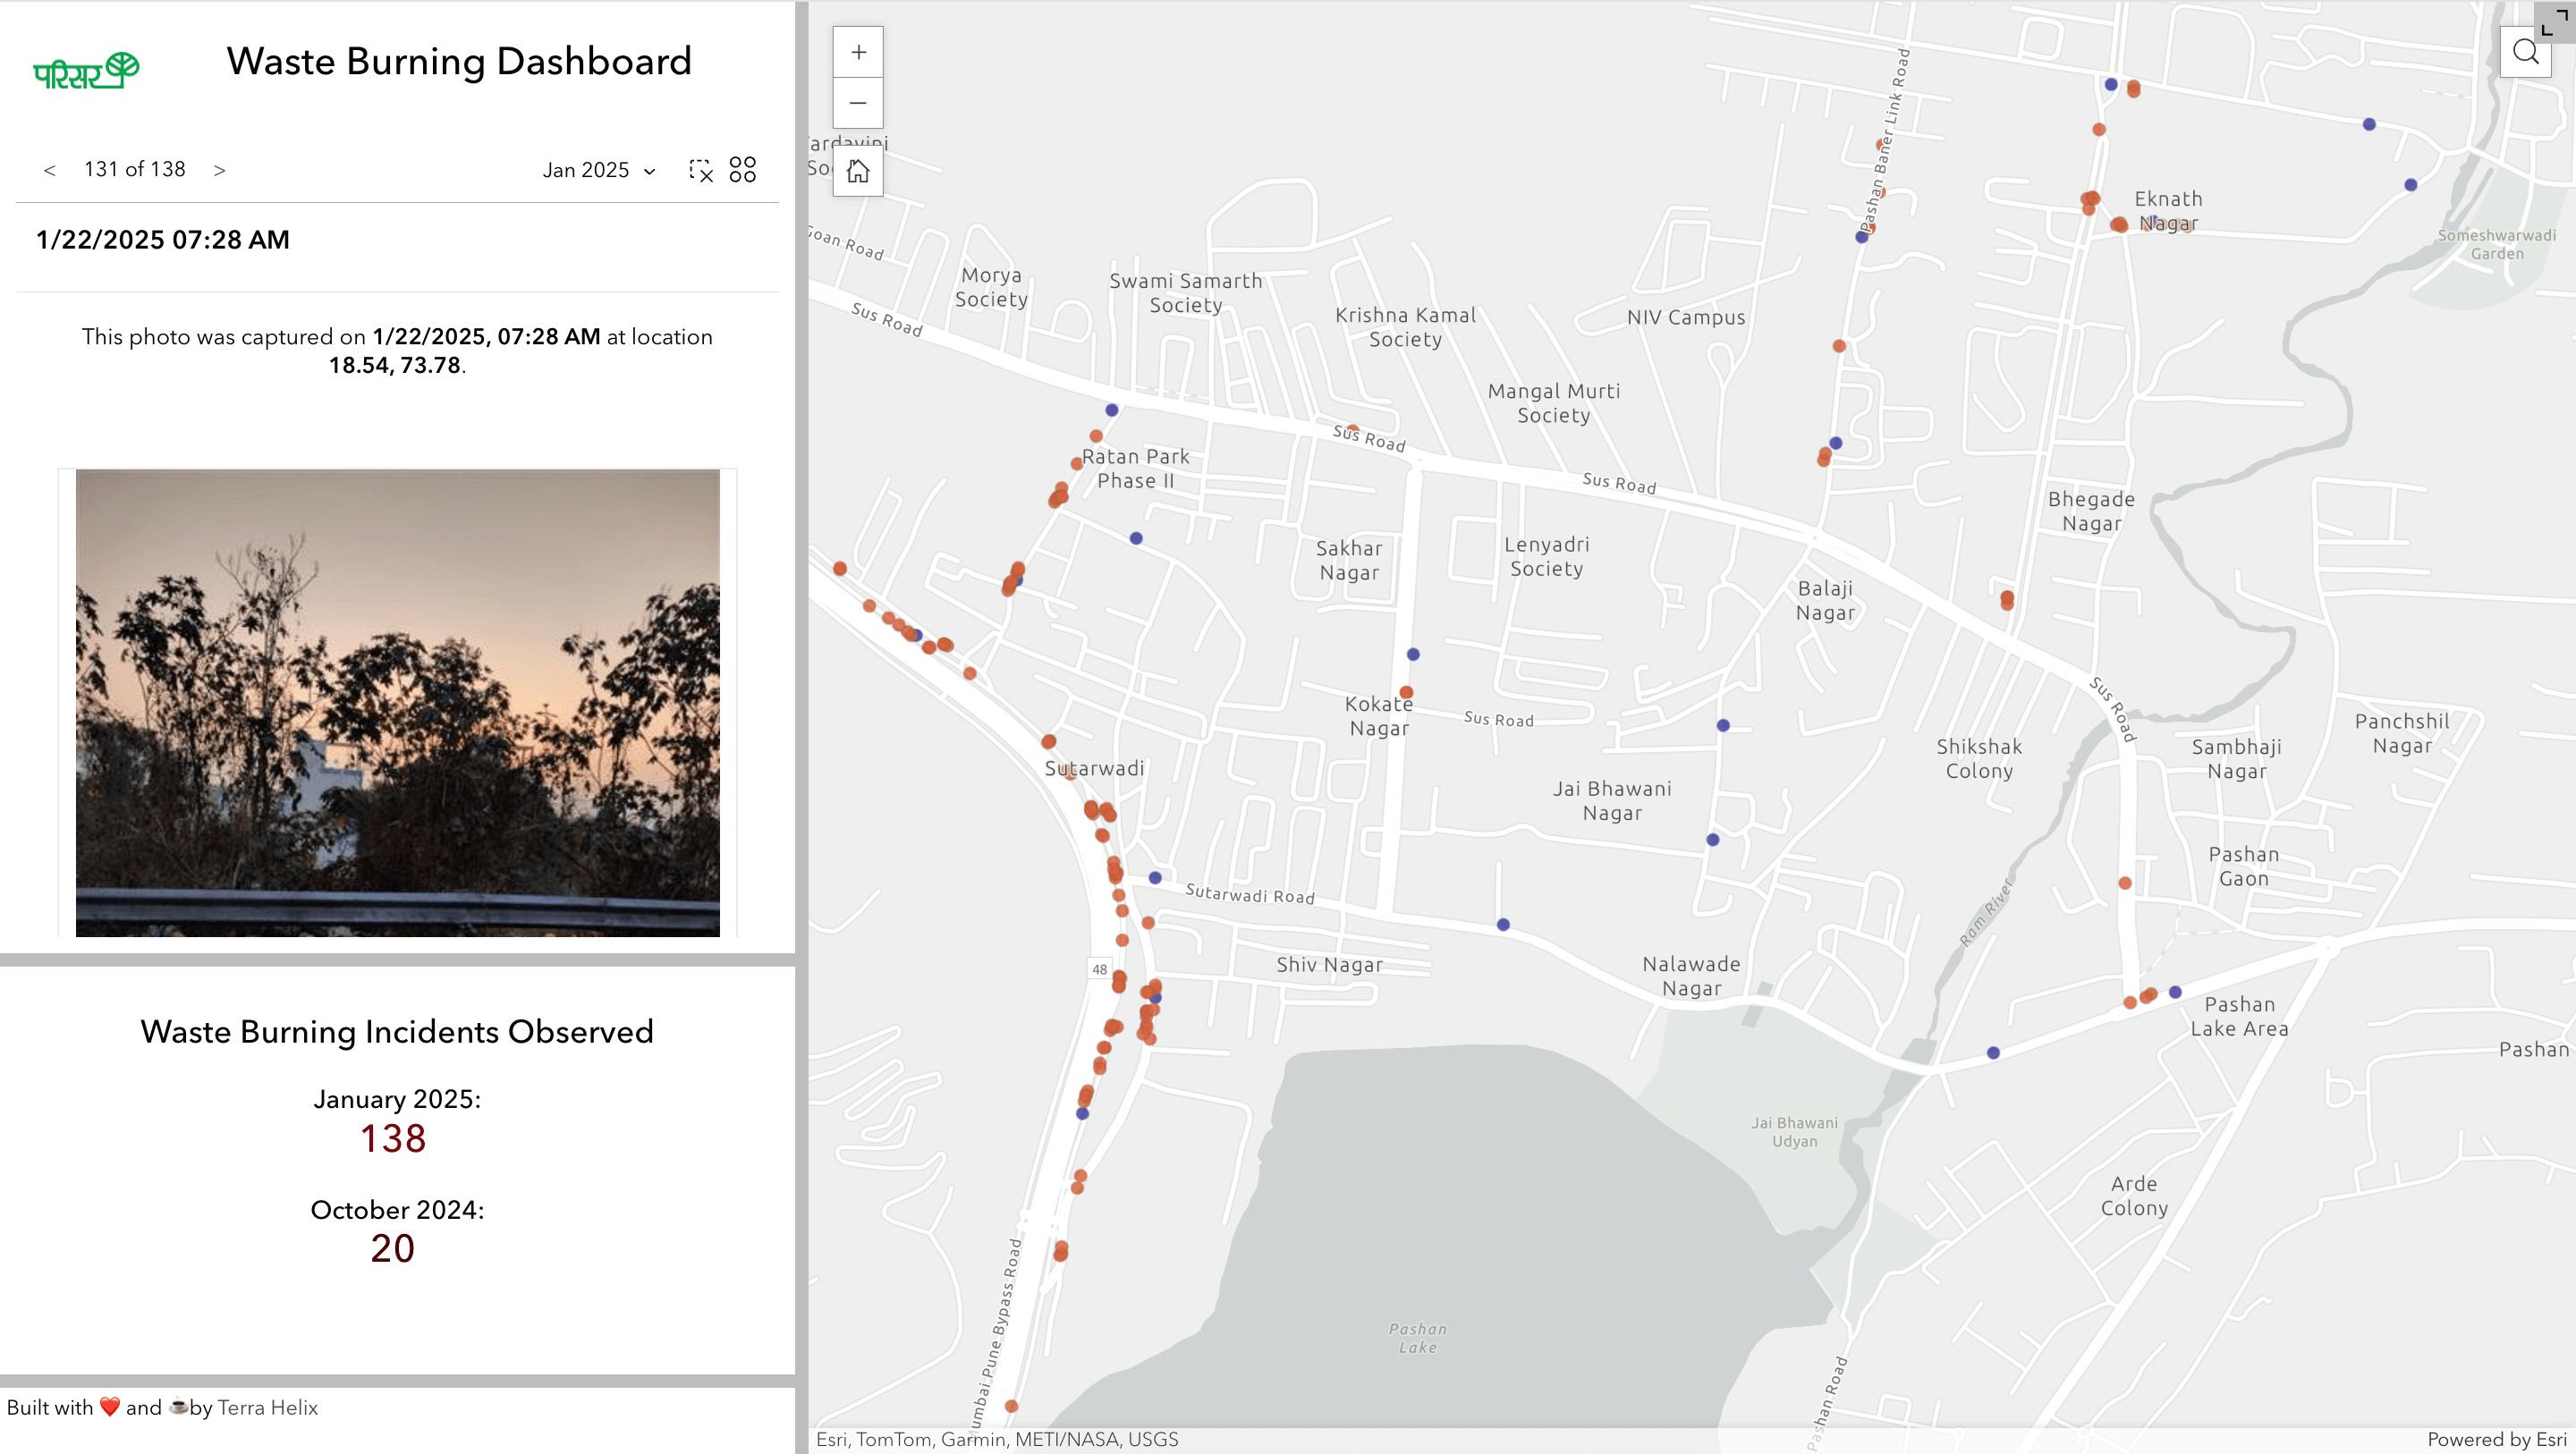
Waste Burning Dashboard
Highlight the prevalence and geographic distribution of waste burning incidents in Pune, India, using a community-sourced, photo-based dataset transformed into an interactive GIS platform.
Use Case
Visualising Waste Burning Incidents
Waste Burning Incident Mapping
Parisar and Terra Helix partnered to visualise community-sourced, geotagged photos of waste burning incidents through an interactive GIS dashboard, aiming to highlight and address environmental concerns in Pune.
The Challenge
Parisar required an impactful method to demonstrate the widespread and frequent nature of waste burning to local authorities, policymakers, and residents. Previously collected photographic evidence lacked a clear and engaging presentation format.
Interactive Features
The dashboard includes a navigable map with markers for each reported waste burning location. Users can explore detailed photographic evidence associated with each marker, facilitating easier understanding of incident frequency and geographic spread.
Community Engagement
By visualising community contributions, the dashboard enhances public engagement and provides a transparent tool for citizens to understand and actively participate in addressing local environmental issues.
Impact
The dashboard has empowered Parisar’s advocacy efforts by clearly demonstrating the prevalence of waste burning, leading to informed discussions with policymakers and stronger initiatives aimed at reducing environmental hazards in Pune.
This Worked for Them — Could It Work for You?
Let’s talk through whether it makes sense for your team.